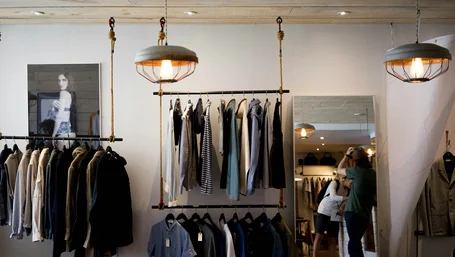
At the end of every season, Maya ran the same calculation. Unsold inventory, marked down or written off. Last spring it was $34,000 sitting on racks that weren't moving. "I kept buying what I thought would sell," she told me. "Turns out what I thought and what the data said were two very different things."
Meet Maya
Maya Chen owns Linden & Co., a women's clothing boutique in a mid-sized city in Colorado. Two locations, eleven employees, and $480,000 in annual revenue built over seven years on genuinely good taste and a loyal customer base.
She didn't have an inventory problem. She had an overstock problem — which is a different thing. Her shop was always full, always curated, always visually appealing. But at the end of each season, 25–30% of what she'd bought hadn't sold at full price. It was either marked down, moved to a clearance rack, or written off entirely.
"The problem wasn't that I was buying bad stuff," she said. "It was that I was buying too much of some things and not enough of others. I'd nail the trend but miss the size run. Or I'd buy eight colorways when four would have done it."
When we first talked in January 2026, Maya wasn't looking for AI tools. She was looking for a buying consultant. I suggested we look at her data first.
The Diagnosis: Three Hours in Her POS
Before recommending anything, I asked Maya to pull three reports from Lightspeed Retail — her POS for both locations:
Report 1: Sell-through rate by category for the last four seasons. What percentage of each category sold at full price, at markdown, and what was written off entirely.
Report 2: Size and variant sell-through. Within each product, which sizes sold cleanly and which consistently ended up on the clearance rack.
Report 3: Velocity by week. For her top 30 SKUs, how did sales pace over the season — fast early and then flat, or slow to start and then pick up?
Three hours of data pulled and exported to CSV. We fed it into ChatGPT with this prompt:
I own a women's clothing boutique. Here is my sell-through data
from the last 4 seasons across both locations: [CSV attached]

Analyze this data and tell me:
1. Which categories consistently underperform (below 65% full-price
   sell-through)?
2. Which size runs have the highest end-of-season carryover?
   (sizes I consistently overbuy)
3. Which sizes have the highest stockout rate mid-season?
   (sizes I consistently underbuy)
4. Which product categories show the highest sell-through velocity
   in the first 3 weeks of a season? (fastest movers I should
   buy more of)
5. Are there any patterns in which vendors' products
   consistently underperform?

Format each finding as a clear table with specific SKU examples.
The output took twelve minutes to generate. What it showed surprised Maya.
Her denim category — which she'd always considered a core strength — had a 58% full-price sell-through rate over four seasons. She'd been buying heavily into denim because it "always works." The data said otherwise.
Her accessories category, which she'd always treated as supplementary, had a 79% full-price sell-through rate. She was systematically underbuying the most profitable category in her shop.
And in her top-selling dress category: she was consistently running out of sizes 6 and 8 by week four of every season, while sizes 14 and 16 regularly ended up on the clearance rack. She'd been buying a balanced size run when her actual customer base required a different distribution entirely.
The 3 Tools Maya Chose
Based on what the data revealed, we chose three tools — each targeting a specific identified problem.
| Tool | Monthly cost | Problem it addresses |
|---|---|---|
| Lightspeed Retail Core | $179/month | Variant-level sell-through analytics, reorder alerts |
| ChatGPT Plus | $20/month | Buying analysis, markdown optimization, email content |
| Klaviyo | $45/month | Purchase-history email segmentation, markdown campaigns |
| Total | $244/month |
Maya was already on Lightspeed Basic at $109/month. The upgrade to Core at $179/month added multi-location inventory intelligence and deeper variant analytics — the feature she needed most for cross-location size run management.
Month 1: The Spring Buying Cycle
The first real test was Maya's spring buying trip in February 2026. She attended the Denver wholesale market, as she did every year.
The difference this time: she walked in with a data brief instead of her instincts.
The data brief she built with ChatGPT:
Based on my sell-through analysis from the past 4 seasons
[paste the ChatGPT output from the diagnostic]:

Create a buying guide for my spring 2026 season that:
1. Recommends category budget allocation based on
   historical sell-through performance
2. Suggests size run distribution for my top 3 categories
   based on which sizes sell cleanly vs. end up on clearance
3. Identifies the 3 vendor relationships I should reduce
   orders with (based on their historical underperformance)
4. Sets a maximum open-to-buy budget for each category
   with a recommended carryover risk threshold
5. Flags any category where I should pilot a smaller
   initial buy and reorder mid-season rather than
   front-loading inventory
The output gave Maya a category-by-category buying plan with specific budget allocations and size run recommendations — something she'd previously built on experience and feel over fifteen years in retail.
She made three significant changes from previous seasons:
1. Reduced denim buy by 35%. The data showed consistent underperformance. She redirected that budget to accessories and tops — her two highest sell-through categories.
2. Shifted her size run distribution. For her top dress category, she moved from a standard balanced size run to a run weighted toward sizes 6–10, matching her actual customer base rather than an assumed national distribution.
3. Piloted "buy light, reorder fast" on three new vendor relationships. Instead of a full seasonal commitment upfront, she bought 40% of her planned quantity at market and planned to reorder mid-season based on actual sell-through data.
Months 2–3: In-Season Management
The Weekly Velocity Check
Every Monday morning, Maya ran a 20-minute routine. Lightspeed Core generates a sell-through velocity report by SKU and location. She exported it and fed the previous week's numbers into ChatGPT:
Here is my weekly sell-through report for [date range]: [data]

Last week's highlights compared to prior weeks:
- Which SKUs are selling faster than expected?
  (I should consider reordering)
- Which SKUs are selling slower than expected?
  (I should consider early markdown)
- Are there any size stockouts developing that I need
  to transfer inventory between locations?
- Based on current velocity, what is my projected
  end-of-season carryover by category?

Flag anything requiring action this week.
This 20-minute routine gave Maya something she'd never had before: a weekly forecast rather than a seasonal guess. By week 6 of the spring season, she could see that two of her new dress styles were pacing 40% faster than average — and she triggered reorders before they stocked out. By week 8, she could see that a jacket category was pacing 25% slow — and she marked it down 15% while there was still enough of the season left for the discount to move product rather than just reduce the write-off.
The Markdown Campaign
When items needed moving, Klaviyo changed how Maya communicated it.
Previously: a sitewide "Sale" email to her full list. Everyone gets the same message, the discount conditions the entire list to wait for markdowns.
With Klaviyo: a targeted email to customers who had previously purchased in the same category. If a jacket style wasn't moving, the email went only to customers who'd bought jackets from Linden & Co. in the last 18 months — customers who already had demonstrated interest in that product type, rather than the full list.
The ChatGPT prompt for the markdown email:
Write a targeted email for customers who previously bought
outerwear from my boutique.
We're offering 20% off on [specific styles] this week.
Tone: warm and personal — like a note from Maya, not a
sale announcement
Mention: the specific styles on offer, why they're worth
having, the limited window
Under 150 words. Subject line: 5 options that feel personal,
not promotional.
The targeted markdown emails generated 34% higher open rates than her previous sitewide sale emails, and the redemption rate was nearly double — because the offer was relevant to the recipient rather than generic.
The Cross-Location Transfer
This was the operational win Maya hadn't anticipated. Lightspeed Core shows inventory across both locations in real time. By week 5, her size 8 in the bestselling dress style was at zero in Location 1 while Location 2 had six units sitting. A manual transfer moved four units to Location 1 — recovering four full-price sales that would otherwise have been lost to stockout.
Before the Lightspeed Core upgrade, this cross-location visibility didn't exist in a usable form. Maya would have found out about the stockout when a customer complained or when she happened to visit the other store.
The Honest Numbers at 90 Days
The spring season ended in late May. Here's what the data showed:
| Metric | Spring 2025 | Spring 2026 | Change |
|---|---|---|---|
| Full-price sell-through rate | 68% | 79% | +11 points |
| End-of-season carryover value | $34,000 | $23,800 | −30% |
| Markdown depth (avg discount) | 28% | 19% | Less aggressive markdowns |
| Stockout events (tracked items) | 14 | 6 | −57% |
| Revenue (spring season) | $112,000 | $118,400 | +5.7% |
The 30% reduction in overstock freed $10,200 in inventory value that in previous seasons would have been either written off or sold at deep discount. That $10,200 goes directly toward next season's buying budget — capital that was previously locked in dead stock is now available for product that will sell cleanly.
Tool cost for the season: $244/month × 3 months = $732 Recovered inventory value: $10,200 Return on tool spend: 13.9×
What Maya Would Do Differently
I asked Maya this question at the 90-day mark.
"I would have upgraded to Lightspeed Core two years ago. The Basic plan wasn't giving me the variant analytics. I knew I had a size problem but I couldn't see it clearly enough in the data to act on it."
"The ChatGPT buying brief felt weird at first. Like I was admitting I didn't trust my own judgment. But it's not replacing my judgment — it's giving my judgment better information to work with. The styles I bought this season were still my choices. I just bought different quantities."
"Klaviyo I should have started sooner. I had a 600-person email list and I was treating everyone the same. The segmentation alone is worth the subscription."
The one thing she got wrong: she waited too long in the season to run the first markdown. The velocity data was showing a jacket category slowing in week 6. She waited until week 9 to act, hoping it would turn around. It didn't. Earlier action on the signal would have meant shallower discounts and higher recovery.
What You Can Take From This
Maya's situation — good taste, loyal customers, consistent seasonal overstock — is the most common inventory problem I see in independent fashion retail. The product isn't the problem. The buying system is.
The three tools in this case study — Lightspeed Core, ChatGPT Plus, and Klaviyo — are accessible to any boutique owner this week. The total cost is $244/month. The analysis that identified the problem took three hours of existing POS data and a ChatGPT session.
The insight that denim was underperforming and accessories were underinvested wasn't obvious from looking at the shop floor. It was only visible in four seasons of sell-through data. That data existed — it just hadn't been analyzed.
That's the pattern. The information is already in your POS. AI makes it readable.